CFO pack (preview)
Example PowerPoint export: Group, last 12 months. Generate your own version with the button.
1. Title
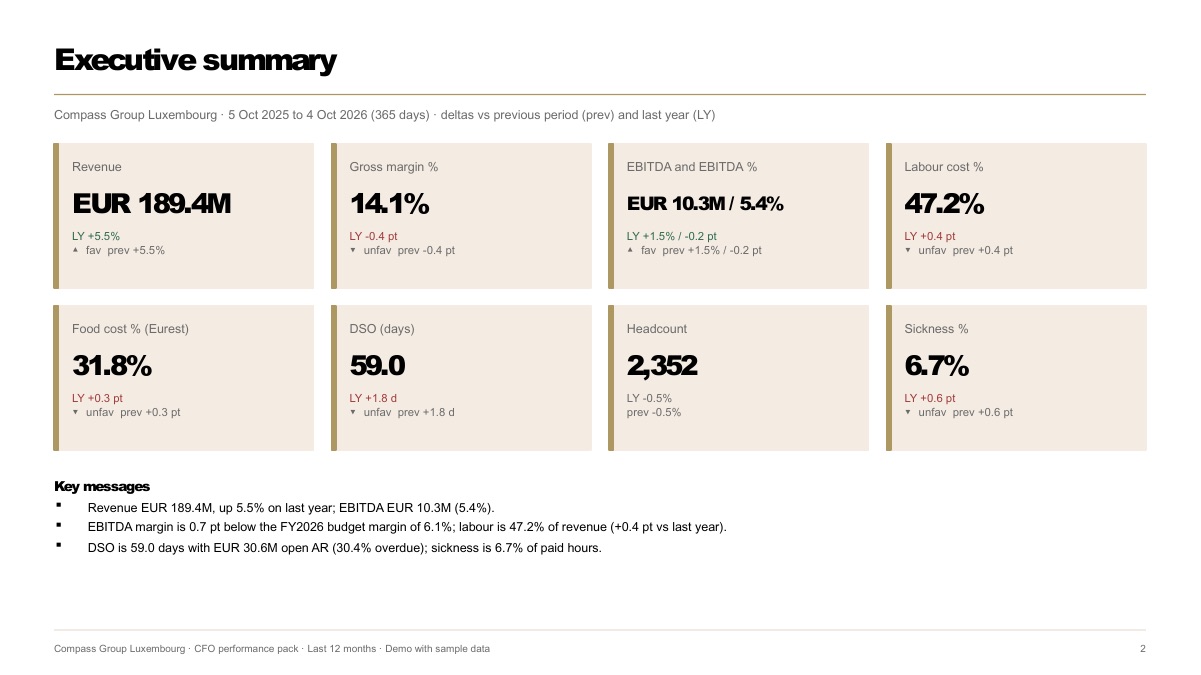
2. Executive summary
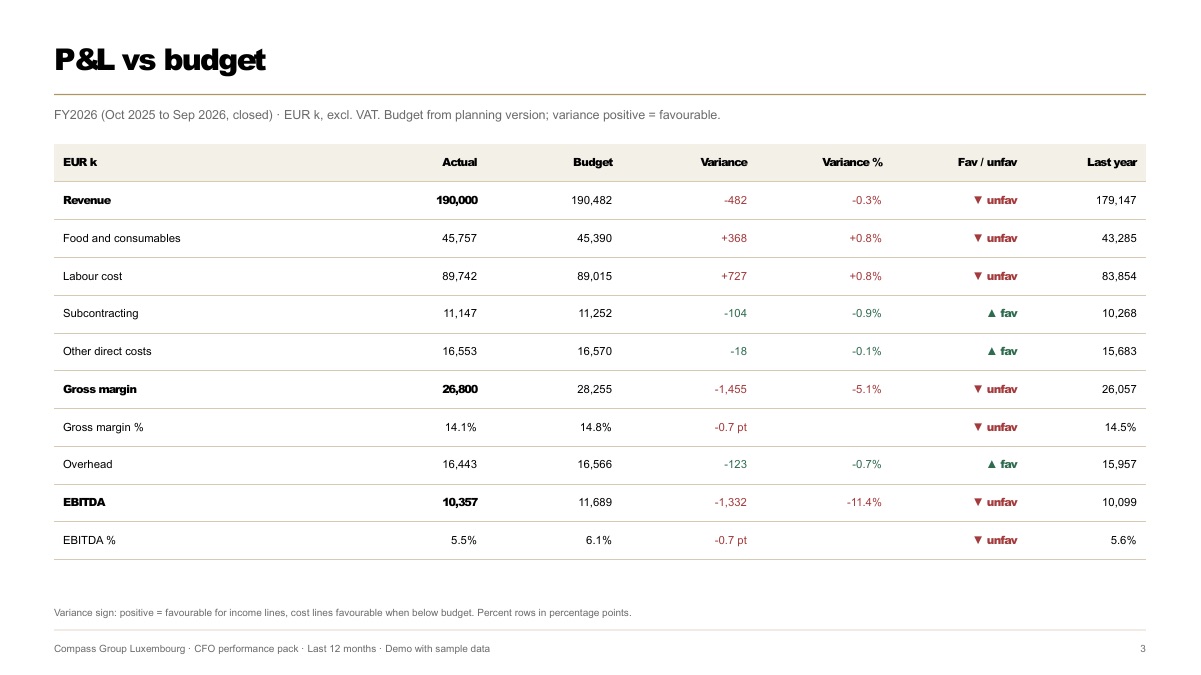
3. P&L vs budget
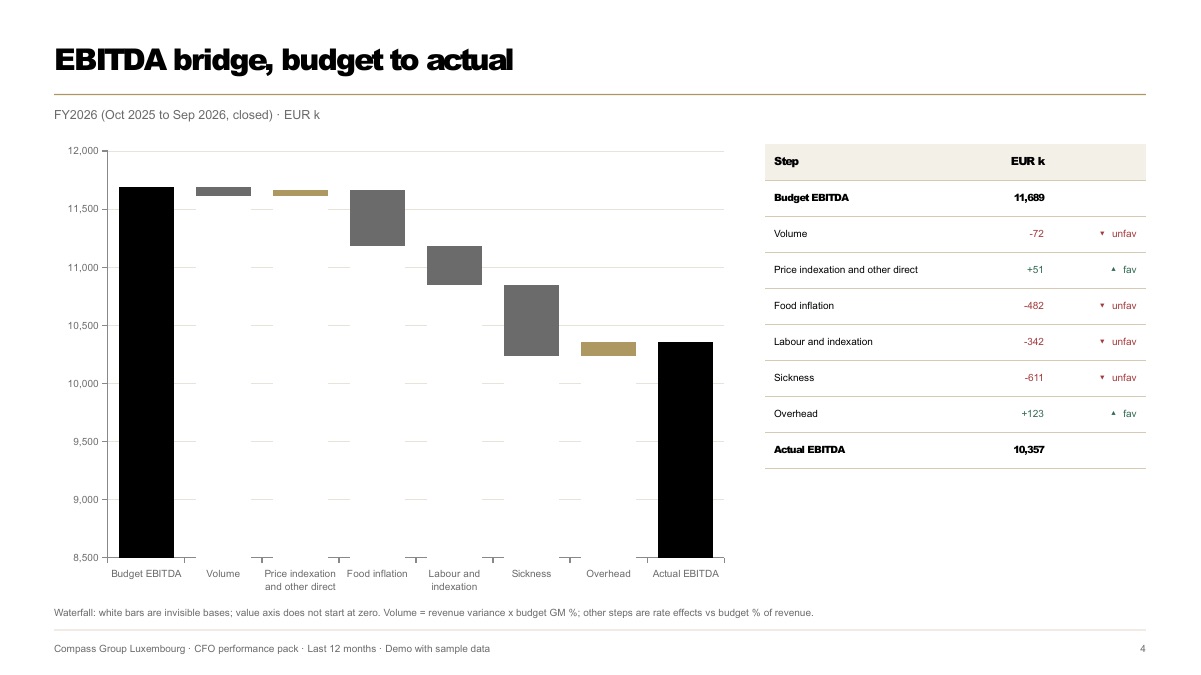
4. EBITDA bridge
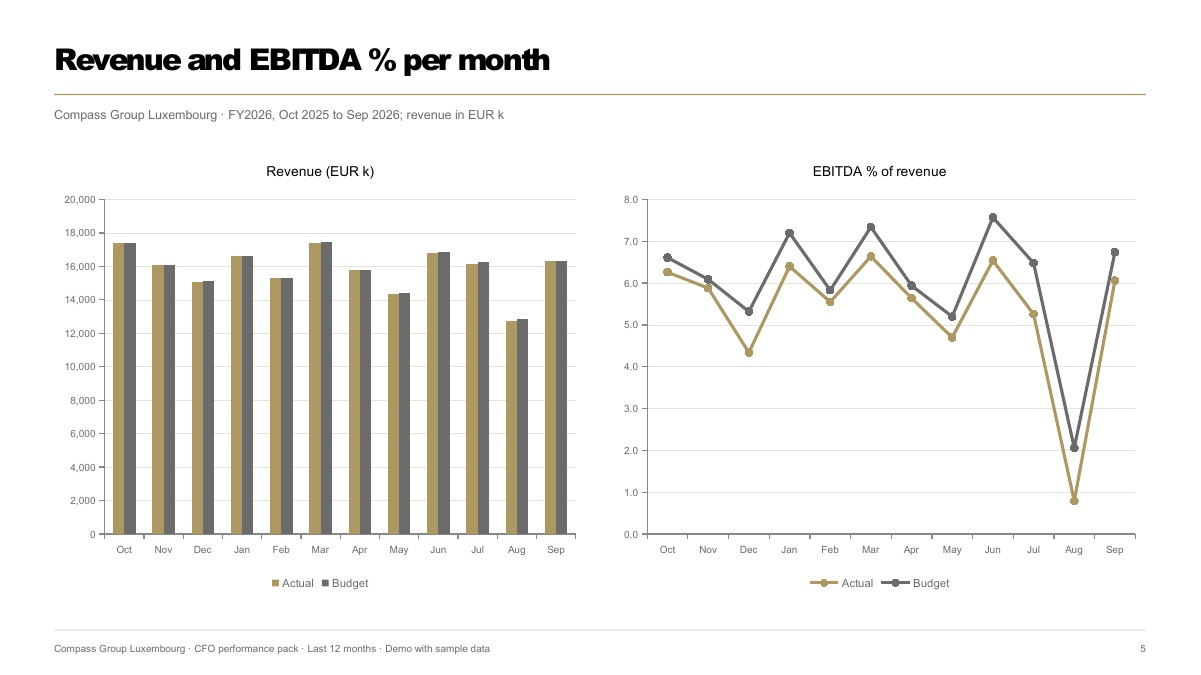
5. Revenue and EBITDA % per month
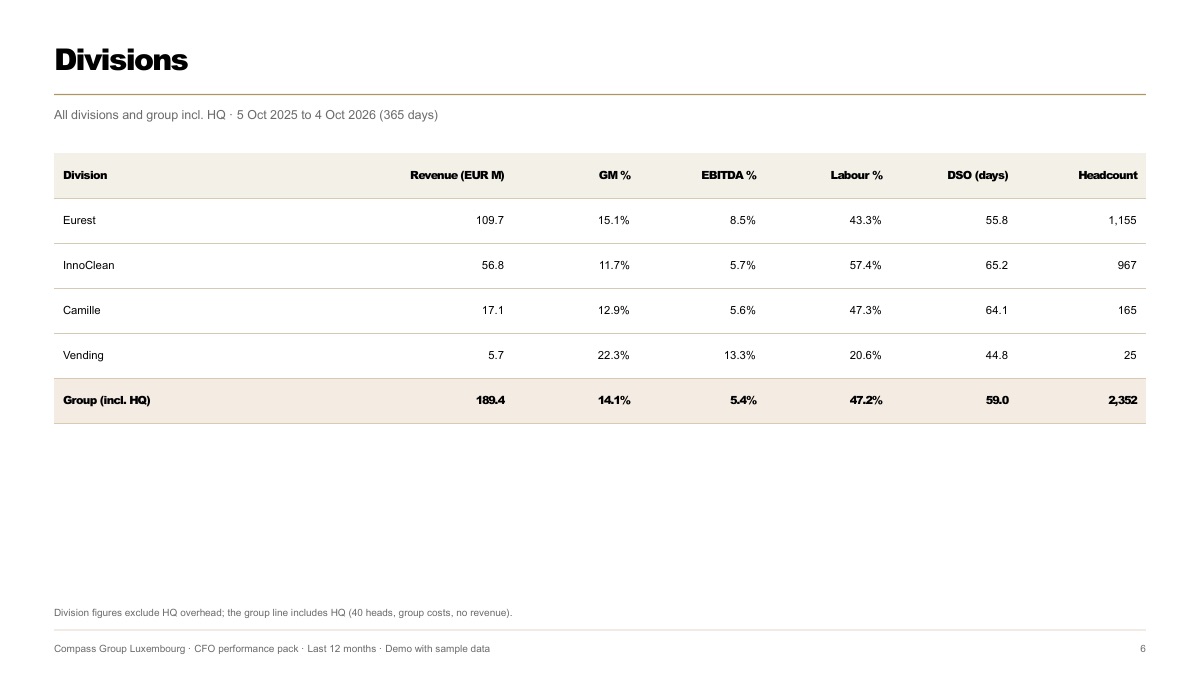
6. Divisions
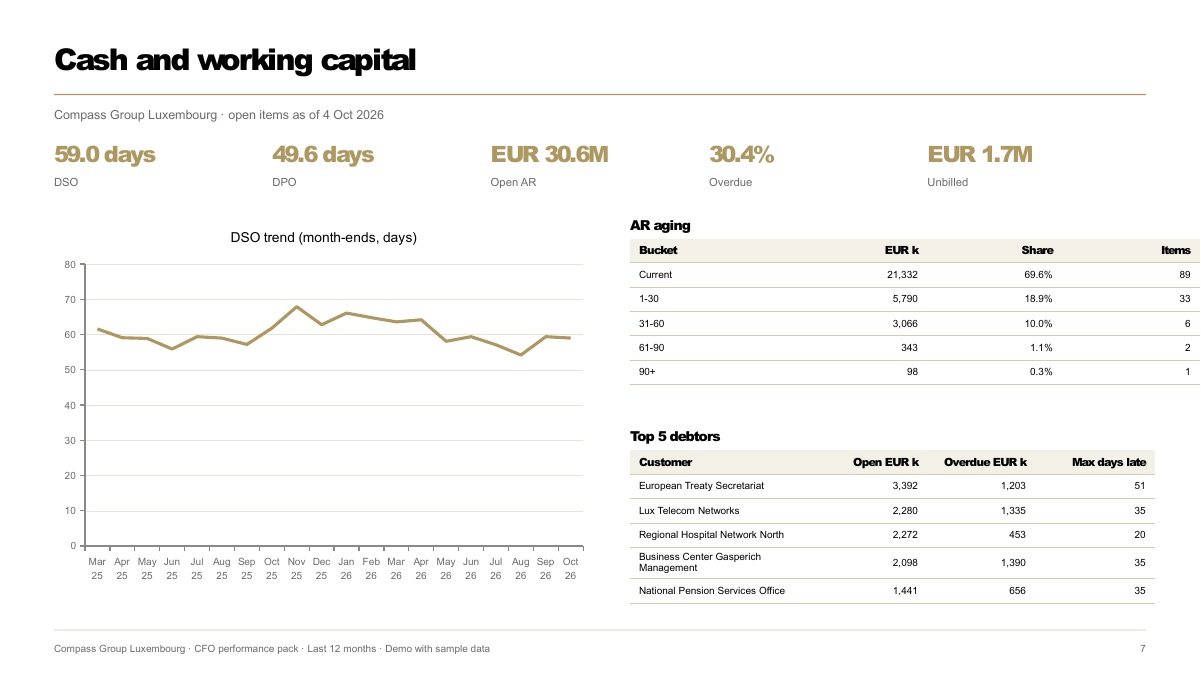
7. Cash and working capital
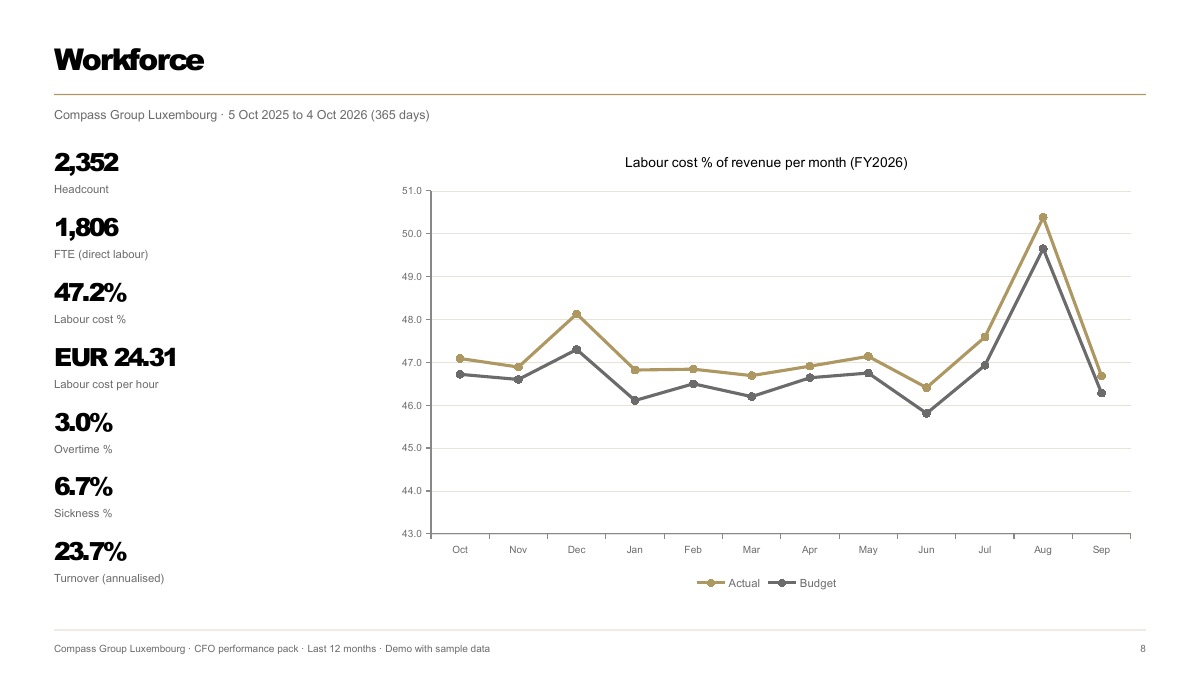
8. Workforce
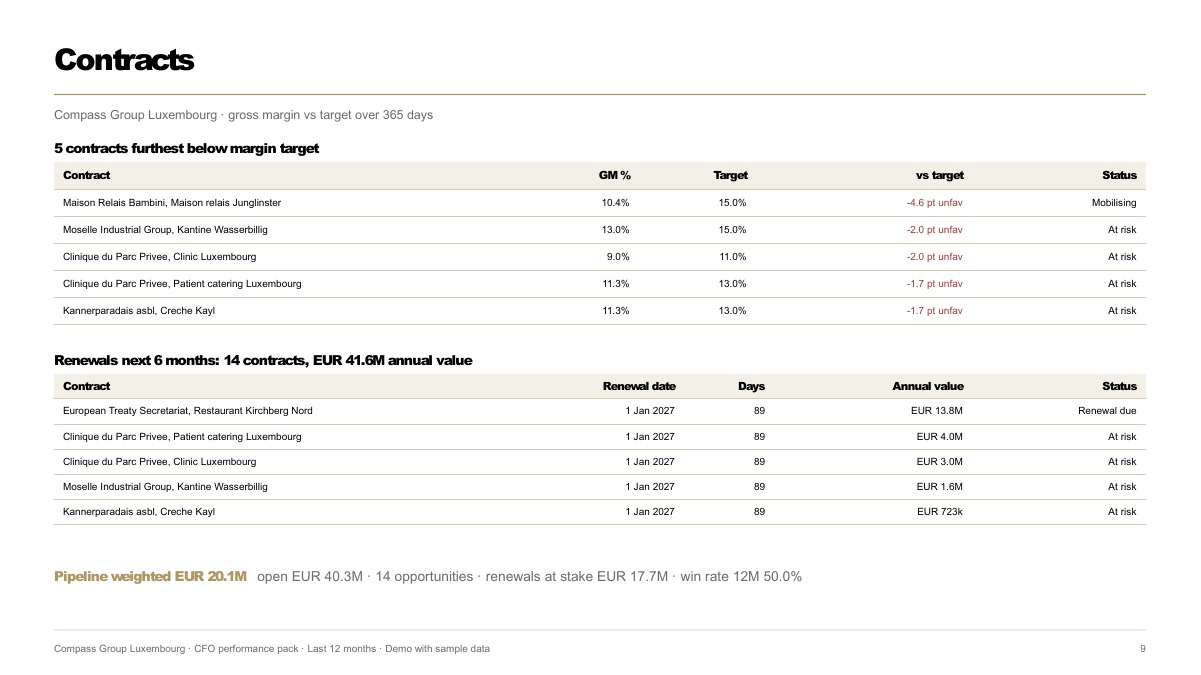
9. Contracts
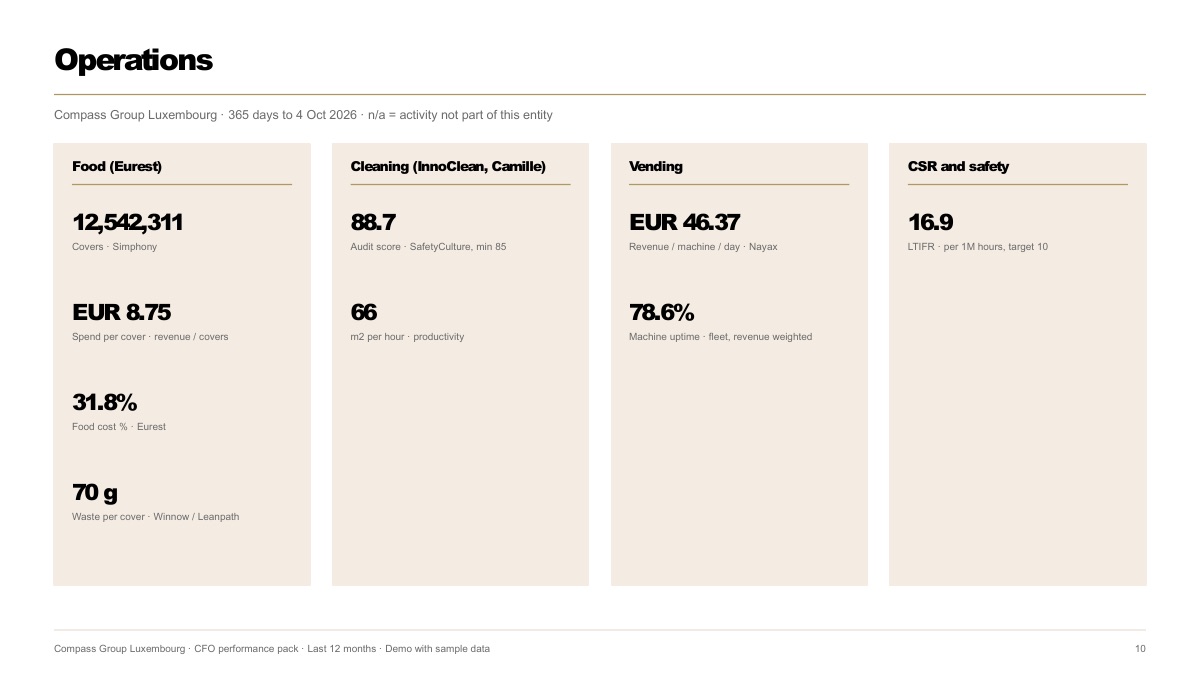
10. Operations
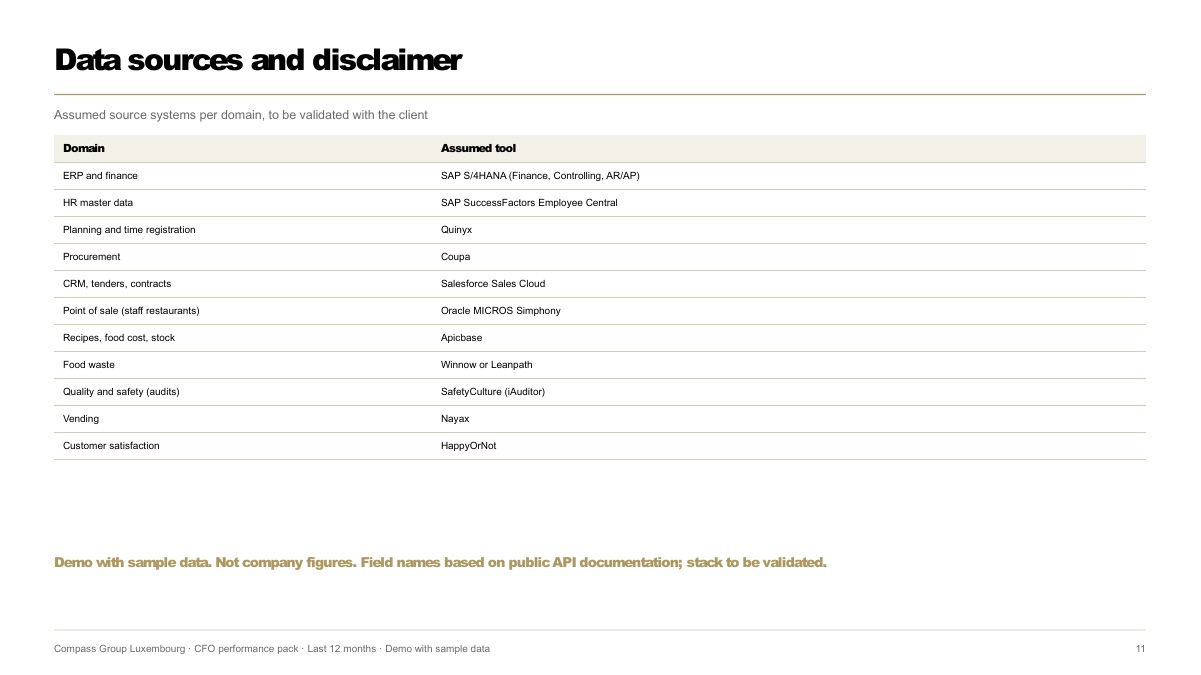
11. Data sources and disclaimer
Rendered via LibreOffice; in PowerPoint the slides use Montserrat and editable charts. Demo with sample data. Not company figures.